April 24, 2026
How to Measure Developer Productivity in 2026

Every engineering leader eventually gets the question from their technology leaders: how productive is the development team? And experienced engineering leaders have all learned, sometimes the hard way, that the obvious answers are wrong. Lines of code reward verbosity. Commit count rewards noise. Story points measure estimation, not output. And a team that gets gamed on any of these will quietly stop building useful things and start optimizing the metric.
The question is still worth answering. Measuring productivity drives budget decisions, headcount planning, technology investments, and whether that platform refactor gets funded or postponed another quarter. The answer most teams converge on in 2026 isn't a single number. It's a system of leading and lagging indicators across delivery, experience, and the architecture developers work within.
This guide covers the frameworks that actually hold up (DORA, SPACE, and the Developer Experience approach), the metrics that do real work, the mistakes that torpedo measurement programs, and the tools teams are using now. It's written for engineering managers, VPs of Engineering, and CTOs who need to report on productivity without alienating the people producing it.
Why Measuring Developer Productivity Is So Hard
Developer productivity is hard to measure because software engineering is knowledge work, and knowledge work resists the simple input-output accounting that works for manufacturing or sales. Lines of code, commit counts, and story points all measure activity, not value. Two engineers can ship the same feature with wildly different code volumes, and the one with less code often did the better job.
This is the thesis Martin Fowler has defended for two decades. "The reason we can't measure productivity is because we can't measure output," he wrote on his bliki (his term for a mix of blog and wiki), and then added the consequence: false measures are worse than no measures because teams optimize for them. Code golfers (developers who chase the shortest or highest-count code rather than the best code) look productive. Busy queues look healthy. Architecture rots quietly while the commit counter spins.
The debate heated up in 2023 when McKinsey published a widely-circulated article titled "Yes, you can measure software developer productivity," proposing a combined framework of DORA, SPACE, and their own opportunity-focused metrics to measure software development productivity. Gergely Orosz and Kent Beck responded on the Pragmatic Engineer newsletter, and Beck's quote is worth sitting with: "The report is so absurd and naive that it makes no sense to critique it in detail."
The practical takeaway is to stop trying to measure individual performance and start measuring systems. Team delivery, team outcomes, and the conditions developers work under. Not the lines of code any single person wrote.
Frameworks for Measuring Developer Productivity
Three frameworks dominate the 2026 conversation. None of them is complete on its own. The strongest measurement programs use more than one.
DORA Metrics
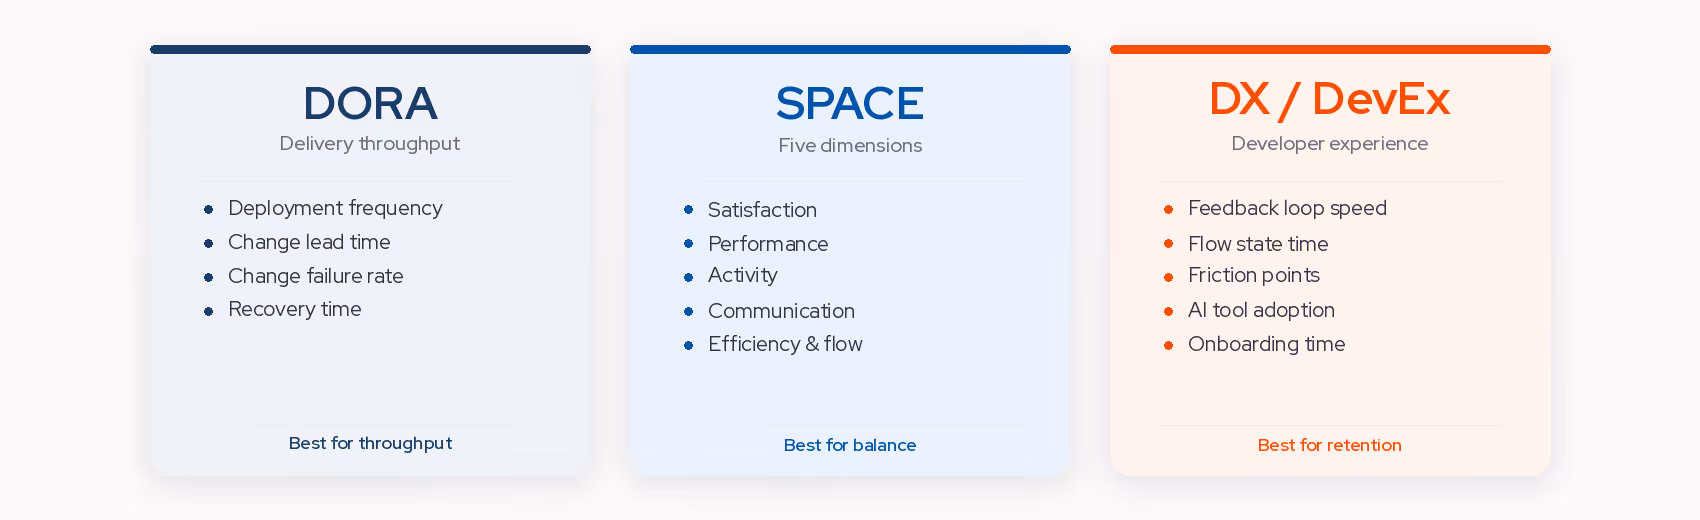
DORA (DevOps Research and Assessment, acquired by Google in 2018) publishes four delivery metrics that have become the industry default for measuring software development teams' throughput. Per the current DORA guides:
- Deployment Frequency: how often code ships to production.
- Change Lead Time: the time from committing a change to that change running in production.
- Change Failure Rate: the percentage of deployments that require immediate intervention.
- Failed Deployment Recovery Time: how long it takes to recover from a failed deployment (DORA updated this terminology from the older "MTTR" / "time to restore service").
DORA also treats reliability as a key outcome area alongside these four, especially when teams need to connect delivery speed with service health. DORA's strength is that the core delivery metrics are quantitative metrics pulled from CI/CD and deployment pipeline data, so they can be computed mostly automatically. Its limitation is that they only measure delivery. They say nothing about whether developers enjoy their jobs, whether the code they're producing is any good, or whether the architecture is quietly strangling throughput.
SPACE Framework
SPACE, published by Nicole Forsgren, Margaret-Anne Storey, and collaborators in ACM Queue in 2021, was designed to capture what DORA misses. The framework's core argument is that developer productivity cannot be measured by a single metric or dimension.
SPACE covers five dimensions:
- Satisfaction and well-being
- Performance
- Activity
- Communication and collaboration
- Efficiency and flow
The useful move in SPACE is that it pulls together qualitative metrics (like satisfaction surveys) with quantitative ones, and tells you to use at least three of the five dimensions rather than just one. A team scoring well on Activity and Performance but tanking on Satisfaction is a team about to churn. SPACE puts that tension on the dashboard where an Activity-only view would have hidden it.
Developer Experience (DX / DevEx)
The third framework, often just called Developer Experience or DevEx, was published by Abi Noda, Nicole Forsgren, Margaret-Anne Storey, and Michaela Greiler to focus on the lived experience of developers: feedback loops, friction, cognitive load, and flow. DevEx is less a competitor to DORA and SPACE than an extension of them. It takes SPACE's Satisfaction and Efficiency dimensions seriously enough to build operational metrics around them, combining developer feedback with data from engineering systems.
The Most Useful Developer Productivity Metrics
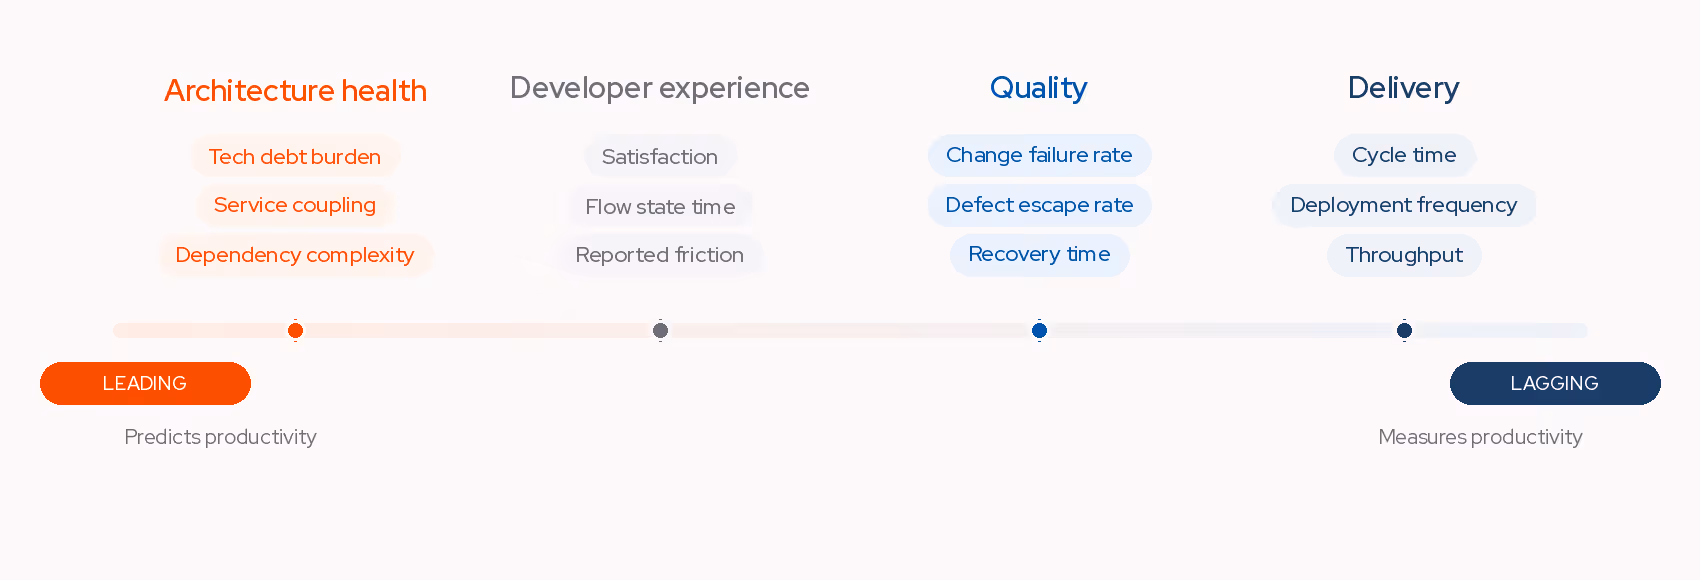
Frameworks organize the thinking. The question most engineering leaders actually face is: which specific metrics should I put on the dashboard? Below are the developer productivity metrics that consistently survive a year of use. They fall into four categories: delivery, quality, experience, and architecture health.
Delivery Metrics
These are the DORA-aligned throughput measures that tell you how fast your team ships.
- Cycle time: time from first commit on a feature to that feature being live.
- Deployment frequency: how often production ships.
- Throughput: features, PRs, or increments shipped per sprint, tracked over time.
Delivery metrics are the easiest to gather and the easiest to misuse. A sudden spike in deployment frequency isn't necessarily good. It may mean the team is shipping tiny incremental changes because the release process is broken.
Quality Metrics
These catch the cost of velocity that delivery metrics don't.
- Change failure rate: percentage of deployments that require rollback or hotfix.
- Defect escape rate: bugs that reach production vs. bugs caught in CI or code reviews.
- Failed deployment recovery time: how long to restore service after a bad deploy.
Teams measured on delivery alone will quietly sacrifice code quality to ship faster. Pairing delivery metrics with quality metrics is the minimum viable measurement program.
Developer Experience Metrics
These are harder to automate but pay off over the long run.
- Developer satisfaction surveys: quarterly pulse checks, ideally with open-ended questions.
- Flow state time: uninterrupted focus blocks per week.
- Onboarding time: from offer accepted to first PR merged.
- Self-reported friction: where developers say they lose time.
DX as a category exists because these metrics catch the problems delivery dashboards miss: a team might deploy twelve times a day while secretly hating every minute of it.
Architecture Health Metrics
This is the category most software development metrics programs quietly skip. It's also where a lot of the explanation for "why is shipping slow?" actually lives. A team with a tangled service graph, high coupling, and rising tech debt will miss feature development targets no matter how many velocity talks the VP of Engineering gives.
Useful architecture health metrics include:
- Tech debt burden: estimated remediation effort as a share of available engineering capacity.
- Service coupling: how many services transitively depend on a given service.
- Change blast radius: the average number of services impacted by a single pull request.
- Dependency complexity: depth and breadth of the runtime dependency graph.
These require a living picture of your system's architecture to compute honestly. You can approximate them from static analysis, but the accurate version uses runtime data. The best measurement programs treat architecture health as a leading indicator of delivery productivity: when coupling creeps up, cycle time creeps up two quarters later.
Summary Table
How to Measure Developer Productivity in Agile Teams
Measuring developer productivity across Agile software development teams brings a specific set of traps. Sprint velocity is the biggest one. It was never designed as a productivity metric. Velocity is a planning signal, useful for predicting how much a team can commit to in the next sprint based on what they finished in the last few. The moment velocity becomes a performance metric, teams inflate story points and the signal dies.
Better ways to measure Agile teams:
- Cycle time per story size: how long does a 3-point story actually take versus an 8-point story? This tells you whether your estimates are consistent and whether your team is learning.
- Throughput over time: count of stories shipped per sprint, tracked across quarters. More stable than velocity because it doesn't depend on estimation.
- Work item aging: how long has the oldest open ticket been open? A quiet signal of WIP (work-in-progress) pile-up.
- Percentage of unplanned work: how much of each sprint gets burned on emergencies. A high number is an architecture or ops problem, not a productivity problem.
Team-level, not individual. Agile teams work as units. Measuring one person's velocity against another's is how you destroy collaboration. Every productivity researcher who's studied this at scale reaches the same conclusion: individual metrics, even when they correlate with outcomes, distort behavior more than they inform it.
Common Mistakes When Measuring Developer Productivity
Measurement programs fail in predictable ways. Four patterns account for most of them.
Goodhart's Law in action. The classic formulation is Marilyn Strathern's: "When a measure becomes a target, it ceases to be a good measure." The engineering version: the moment PR count becomes a review criterion, engineers start splitting PRs. The moment cycle time becomes a KPI, teams quietly reclassify work to game the clock. This isn't malice. It's a rational response to being measured, and Beck's point is the same:
"The earlier in the cycle you measure, the easier it is to measure. And also the more likely that you introduce unintended consequences."
Individual performance metrics. Ranking engineers by lines of code, commits, pull requests, or any other proxy is how you produce a team that optimizes for what gets measured and abandons the work that doesn't. See Goodhart, again. Even DORA, which is explicitly team-level, breaks badly when applied to individual performance.
Delivery-only measurement. Teams that measure only DORA miss half the picture. Delivery metrics can look great while developer experience craters and tech debt accumulates. Eighteen months later, those developers leave, the architecture seizes, and the dashboard is still green. Pair delivery with experience and architecture health, or you're measuring the wrong thing.
The 80/20 problem. A common trap in software development is assuming the 80/20 rule means 20% of developers do 80% of the work, and therefore those 20% should be identified and rewarded. This framing is usually a poor management shortcut. Raw activity data can make individual contribution look wildly uneven, but the causes are often team structure, architectural access, code ownership, and coordination cost. Improving the system improves everyone's output far more than identifying "10x" engineers (the industry shorthand for developers said to produce ten times the output of peers) ever will.
Tools for Measuring Developer Productivity
The developer productivity measurement tools market in 2026 breaks into three categories: DORA and delivery-metric platforms, developer experience platforms, and architecture intelligence platforms. Most serious measurement programs use one from at least two of these categories, surfaced through a unified developer productivity dashboard. A broader sweep of adjacent categories shows up in our software architecture tools roundup.
LinearB integrates with Git, issue trackers, and CI/CD to compute DORA and pull request cycle metrics across the software delivery lifecycle. Freemium.
- Best for: DORA and PR-cycle metrics on a dashboard.
- Watch out for: Delivery metrics without business or architecture context.
Jellyfish ingests data from Git, Jira, and CI/CD systems to surface engineering metrics, allocation breakdowns, and delivery forecasts in a unified engineering management dashboard. Paid.
- Best for: VP- and CTO-level investment allocation views alongside delivery metrics.
- Watch out for: Setup complexity; aimed at larger engineering orgs.
DX (GetDX) combines developer surveys with workflow telemetry to produce metrics specifically on developer experience and productivity, including AI coding assistants adoption. Paid.
- Best for: Programs using SPACE as the anchor framework.
- Watch out for: Survey fatigue if the cadence is too frequent.
Swarmia is an engineering insights platform that combines Git, issue-tracker, and CI data with lightweight developer surveys to highlight team blockers and DORA metrics. Paid.
- Best for: Teams that want DORA plus developer feedback in one tool.
- Watch out for: Overlap with LinearB and Jellyfish; evaluate alongside, not as a replacement.
Flow (by Appfire, formerly Pluralsight Flow / GitPrime) analyzes commit, pull-request, and ticket data from Git and issue trackers to generate engineering workflow and Git-activity metrics. Paid.
- Best for: Git-activity analytics for managers coming from the GitPrime-era toolchain.
- Watch out for: Rebrand means documentation and pricing have moved; verify current plan details.
Catio is the architecture intelligence platform in this landscape. It doesn't measure delivery velocity directly. Instead, it adds the architecture health dimension that the delivery-metric and DevEx tools miss. Catio's architecture observability platform connects architecture and operational data sources to map the tech stack and dependencies, and Archie, its conversational copilot, answers questions like "which services have the most coupling?" or "where is our technical debt concentrated?" Those are the questions productivity retrospectives often end at without answers.
- Best for: Adding architecture health as a leading indicator alongside delivery metrics.
- Watch out for: Not a DORA replacement; pair with a delivery-metrics tool.
The argument for stacking these is straightforward: delivery metrics tell you what your team ships; architecture metrics tell you why shipping is slow or fast.
Teams iterating on effective AI engineering workflows often end up stacking tools from all three categories. A DORA platform for throughput, a DevEx platform for signal, and an architecture intelligence platform for the "why" behind both.
Building a Developer Productivity Measurement Program
The difference between a measurement program that can improve developer productivity and one that dies after two quarters is structural, not technical. Six moves that hold up:
- Baseline before you target. Instrument first, set goals second. Trying to improve a development process metric you haven't measured for three months is how you end up optimizing noise.
- Pick three to five metrics across frameworks. One from delivery (cycle time). One from quality (change failure rate). One from experience (satisfaction). One from architecture health (tech debt burden or service coupling). More than five and you're measuring everything and acting on nothing.
- Measure team-level, not individual. Report aggregates, never rankings. Ranking engineers on any of these metrics is the fastest way to destroy the signal.
- Iterate quarterly. Review metrics every quarter, ask which ones are still surfacing real problems, and retire the ones that aren't. Metrics have a half-life.
- Make the architecture legible. Improvements in cycle time and failure rate often trace back to reductions in coupling, duplication, or drift that delivery dashboards don't surface. Platforms that connect architecture data to business strategy let engineering leaders quantify the cost of tech debt in developer time and use that data to optimize developer productivity, not just manage abstract risk.
- Publish the methodology. Whatever you measure, explain it. Developers who understand the why behind a metric game it less.
The measurement program isn't the goal. Shipping better software with happier engineers is. Metrics that don't tie back to delivered business value should be replaced with ones that do.
Conclusion
Measuring developer productivity in 2026 is less about finding a better single metric and more about instrumenting the whole software development process. DORA tells you how fast your team ships. SPACE tells you how sustainable that pace is. DevEx tells you how the work feels. Architecture health tells you what the code itself is doing to throughput. The best measurement programs combine them, measure engineering teams rather than individuals, and iterate on the dashboard every quarter.
If you want to add the architecture-health dimension that most productivity dashboards miss, explore how Catio builds a live picture of your real tech stack, or book a demo to see the architecture intelligence layer in action.
FAQ
Can developer productivity be measured? Partially. Teams can measure software developer productivity at the team level with frameworks like DORA and SPACE, combined with developer experience surveys and architecture health metrics. Individual-level productivity is much harder to measure without distorting behavior, and most researchers (including Martin Fowler and the SPACE authors) argue teams shouldn't try. The useful answer is to measure team outcomes and the conditions developers work under, not individual output.
What is KPI in developer productivity? Common KPIs include the four DORA metrics (deployment frequency, change lead time, change failure rate, failed deployment recovery time), developer satisfaction scores, cycle time per story, and architecture health metrics like tech debt burden or service coupling. A good developer productivity KPI set draws from multiple frameworks and reports at team level.
What is the 80/20 rule in software development? The 80/20 rule, applied to software, is often cited as "20% of developers produce 80% of the output." Most research doesn't support this framing when you measure outcomes rather than commits. What looks like outsized individual output usually reflects team structure, architectural access, or coordination cost. Improving the system typically does more than identifying individual stars.
What are the best DORA metrics benchmarks? DORA publishes annual State of DevOps benchmarks and distributions for metrics like deployment frequency, change lead time, change failure rate, and failed deployment recovery time. Benchmarks shift each year, so use the current report rather than cached thresholds.
Share this Post