August 14, 2026
System Diagrams: What They Are, Types & How to Use Them

Every architecture review has the same moment: someone pulls up a system diagram from eighteen months ago, and half the room starts arguing about whether it's still accurate. Nobody drew it wrong. The system just moved: a service got split, a queue got swapped, a team added a caching layer nobody documented, and now the picture on the screen describes a system that no longer exists.
This guide covers what a system diagram actually is, the main types you'll run into, how a system diagram differs from an architecture diagram, and a practical process for building one. It's written for software architects, platform engineers, and technical leads who need a working definition and a usable diagram, not a design-theory lecture.
What Is a System Diagram?
A system diagram is a visual model that shows a system's boundary, its major components, and how those components and external actors exchange information. It simplifies a complex system into something a reader can absorb at a glance, showing inputs, outputs, and subsystems without getting lost in implementation detail. The point is not exhaustive implementation detail; it is the right level of precision for the decision, shared understanding at a high level, fast enough to support a conversation instead of interrupting one. Precision still matters for diagrams supporting network design, data flow, security, or incident response decisions.
System Diagram vs. Architecture Diagram: What's the Difference?
The two terms get used interchangeably, and that distinction is worth sharpening rather than discarding. An architecture diagram is the broader category, and a system diagram is one visual representation within it.
Software architecture covers the actual decisions: how components are structured, which patterns govern communication, what trade-offs were made and why. A system diagram is one attempt to picture that architecture at a point in time, and it's one kind of architecture diagram rather than a separate category. You can have a great architecture and a terrible diagram of it, and you can have a beautiful, well-organized diagram of an architecture nobody actually decided on. The diagram is downstream of the architecture, not the same thing as it.
This distinction matters more once systems get complicated, which is exactly the terrain system architecture as a discipline covers: the patterns, the components, and the design process that produces them. A system diagram communicates a slice of that architecture to a specific audience. For the craft of building diagrams people actually use, the art and science of architecture diagrams is the companion piece, covering graph theory, hierarchy, and layout choices that separate a diagram that clarifies from one that just adds more boxes to look at.
Types of System Diagrams
"System diagram" is an umbrella term, and different types answer different questions. Picking the wrong type for the audience is one of the more common ways a diagram fails before anyone reads it. Take a generic web app as an example: a context diagram would show it talking to users and a payment provider; a container or component diagram would break it into pieces such as an API service, a database, and a frontend; and a data flow diagram would trace how a submitted order moves from the checkout form into the database and out to a fulfillment queue. Here's how the main types break down.
System Context Diagrams
A system context diagram defines the boundary between a system and its environment, showing which external entities interact with it, without exposing any of the system's internal structure. Everything inside the boundary is one box; everything outside (users, third-party APIs, adjacent systems) sits around it, connected by lines that represent interaction, not implementation.
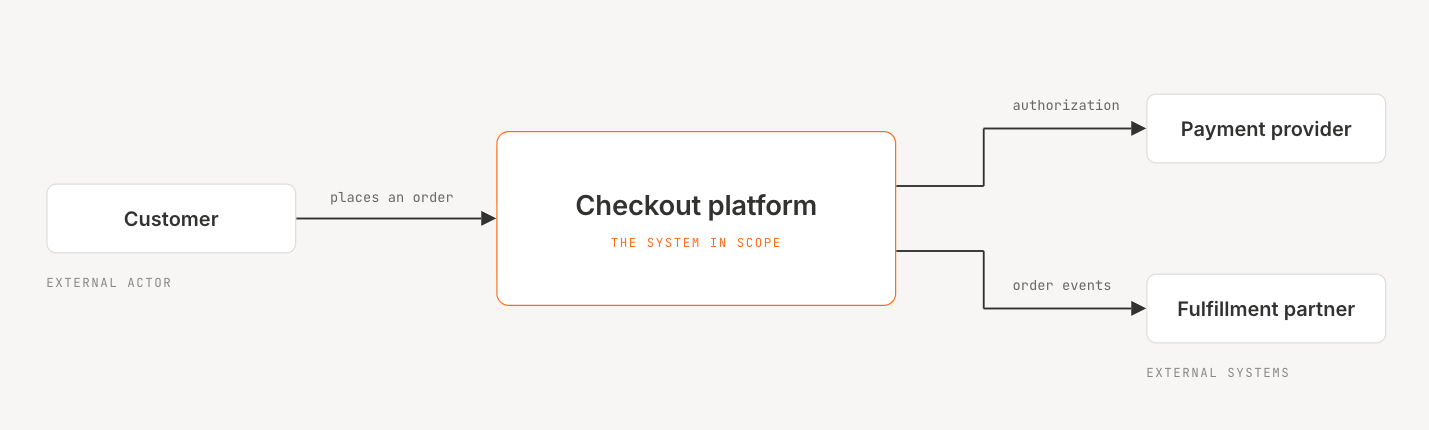
The goal is to focus attention on the external factors a team needs to account for when defining requirements and constraints, not to explain how the system works internally. The C4 model, a widely used approach to software architecture diagramming, organizes diagrams into four levels: System Context, Container, Component, and Code. It puts the system context diagram at the top of that hierarchy for exactly this reason: it's the diagram most people can read regardless of technical background.
Block Diagrams
A block diagram illustrates the relationship between a system's components using labeled boxes and connecting lines, focused on functionality rather than physical layout.
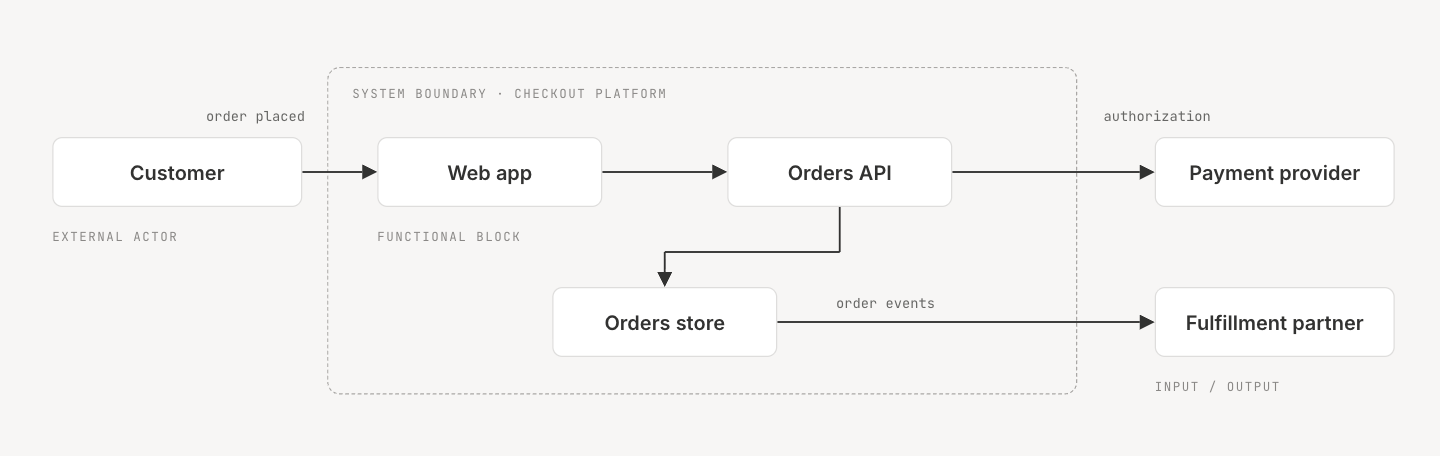
That's true for most software block diagrams; in electrical and mechanical systems, a block diagram's blocks often map more closely to actual physical subsystems, so the physical-versus-logical distinction depends on the domain. It's the diagram you reach for when a non-technical stakeholder needs to understand what a system does without needing to understand how it's deployed. Block diagrams trade precision for speed of comprehension, a fair trade-off in a kickoff meeting where the goal is shared understanding, not implementation detail.
Network Diagrams
Network diagrams represent the communication paths and connections between components using nodes and edges, showing interdependencies within a network's infrastructure.
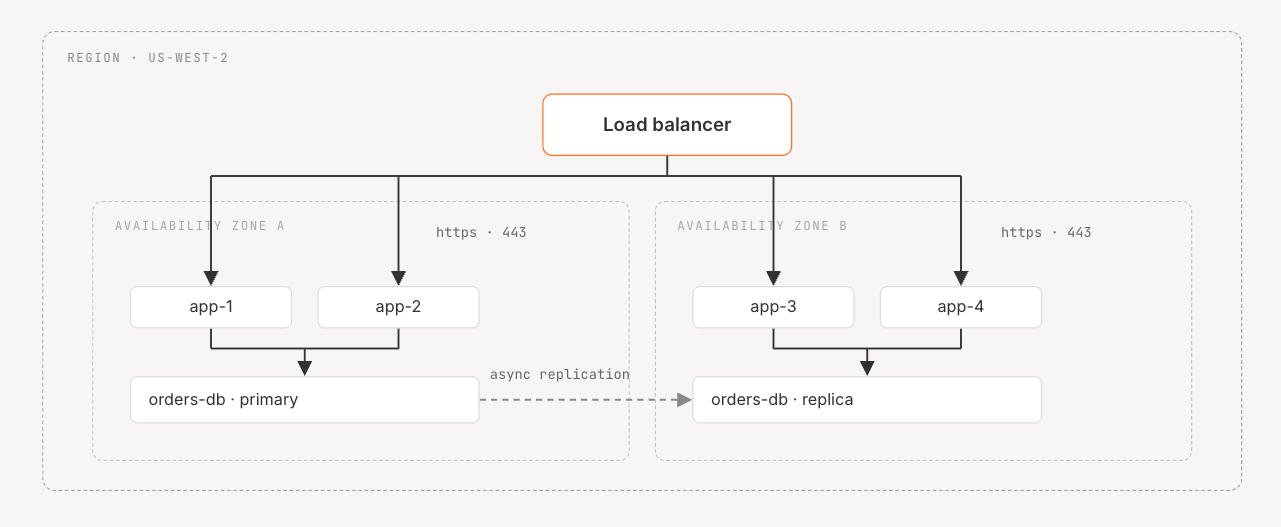
These get specific fast: regions, availability zones, load balancers, subnets. They're built for the audience reasoning about where traffic actually goes and what happens if a given path fails, making them a common reference during an incident review.
UML & Sequence Diagrams
UML (Unified Modeling Language) diagrams represent the structure, behavior, and interactions of software systems using a standardized notation. Sequence diagrams, a specific UML type, show the order in which components exchange messages over time, useful for tracing one interaction (a login flow, a checkout process) step by step rather than showing the whole system at once.
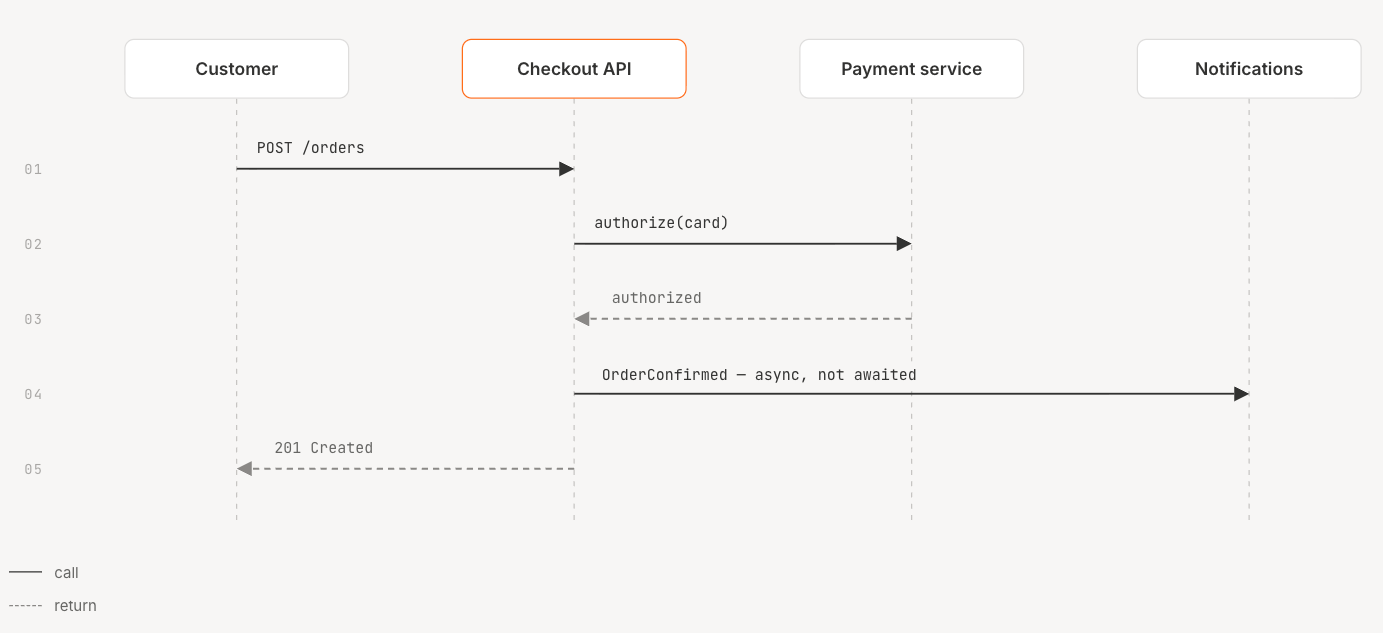
Developers reach for UML when the question isn't "what exists" but "what happens, in what order, and who's waiting on whom."
Data Flow Diagrams
A data flow diagram illustrates how data moves within a system, from input through processing to output, without describing control flow or timing.
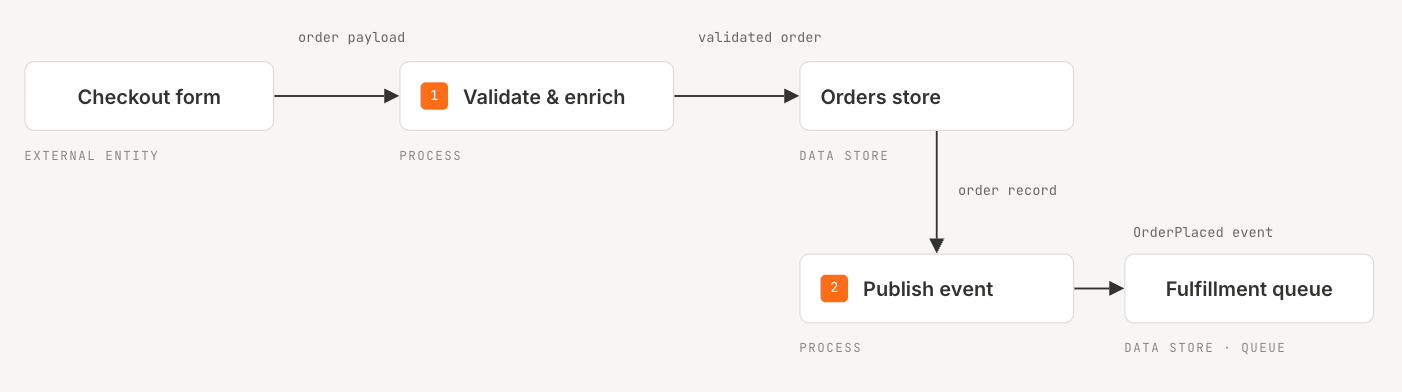
Where a network diagram cares about infrastructure, a data flow diagram cares about one thing: information flow, meaning where the data comes from, what transforms it, and where it ends up. That focus makes data flow diagrams the right tool for compliance reviews and data lineage questions.
What Do System Diagrams Look Like? Key Components
Strip away the specific diagram type and most system diagrams share a handful of core building blocks. Feedback loops and time lag show up too, though they're sometimes useful for dynamic systems specifically rather than a fixture of every diagram.
- System boundary. The line (usually a box) separating what's inside the system from what's outside it. Everything crossing this line is an input, an output, or an external dependency.
- Components or subsystems. The functional pieces inside the boundary: services, databases, modules, or teams.
- Inputs and outputs. What enters and leaves the system, and through which interface.
- External factors. Anything outside the boundary that still influences behavior, such as a third-party API's rate limits or a regulatory requirement.
- Feedback loops. Sometimes useful for dynamic systems: where a system's own output eventually influences its future input. A reinforcing loop amplifies a change (more users drive more investment, which drives more users); a balancing loop counteracts one (rising latency triggers autoscaling, which brings latency back down).
- Time lag. Also mainly relevant for dynamic systems: the delay between a change and its visible effect, often the reason a feedback loop looks broken when it's actually just slow.
Not every diagram needs all of these. A whiteboard sketch might only need a boundary and a few components; a diagram explaining behavior under load needs the feedback loops and time lags too.
How to Create a System Diagram (Step-by-Step)
Building a usable system diagram is less about drawing skill and more about scoping discipline:
1. Define the purpose. Decide what question this diagram needs to answer. "How does data move through checkout?" and "What talks to what during an outage?" are different diagrams, even for the same system.
2. Set the system boundary. Draw the box, literal or conceptual, separating your system from everything else. This decision shapes everything downstream.
3. Identify the subsystems or components. List the pieces inside the boundary that matter for your stated purpose, and skip internal detail that doesn't serve that question.
4. Map inputs, outputs, and external factors. Add the entities outside the boundary that interact with what's inside, and label what flows across each connection.
5. Choose the right diagram type. Match the type to the audience and purpose from the table above: context for stakeholders, network for infrastructure, UML or sequence for developers, data flow for compliance.
6. Favor a common, non-technical visual language. Boxes, arrows, and short labels travel better across a mixed audience of engineering and non-technical stakeholders than notation only specialists recognize.
7. Validate with the people who'll rely on it. If they can't tell you what the boundary represents or where a piece of data goes, the diagram needs another pass.
What Is SysML and UML? (And When You Need Them)
UML and SysML solve related but different problems, and mixing them up leads to picking the wrong tool for the job.
UML (Unified Modeling Language) is a specification for a graphical language used to visualize, specify, construct, and document the artifacts of distributed object systems. It's a fixture of software development: class diagrams, sequence diagrams, and state diagrams, all describing how code and components behave and relate to each other.
SysML (Systems Modeling Language) is a general-purpose modeling language for systems engineering, built to support a model-based systems engineering (MBSE) approach. It extends past software engineering into the physical and organizational: requirements, hardware, business processes, verification cases.
The short version: use UML for software behavior and structure; use SysML when your system spans software, hardware, and process. Most software teams do not need full SysML, and many don't need formal UML either. A diagram meant for internal use is often served just as well by lightweight UML or C4-style notation, an informal box-and-arrow sketch, a sequence diagram, or a diagrams-as-code tool, just enough structure to give reviewers a common language for a design conversation instead of a pile of unlabeled boxes.
Tooling matters too. PlantUML, an open-source tool, generates UML diagrams from plain-text descriptions rather than a drag-and-drop canvas. Mermaid and Structurizr are common adjacent options built around that same diagrams-as-code idea. That text-first approach points at the next problem: a diagram living as a text file can be versioned and diffed like code, while one living as an exported image can't.
Why System Diagrams Break Down at Enterprise Scale
The standard advice on system diagrams tends to skip a step: the diagram is usually accurate on the day you draw it, and it starts drifting the moment someone ships the next change. A team draws a careful system diagram during a kickoff, everyone nods, and six months later the diagram still shows a service that's been replaced and a data flow that no longer exists. Nobody updated it because updating diagrams isn't anyone's job, and by the time it matters, nobody remembers it needs updating.
This shows up often enough that we list it as one of the named reasons teams outgrow static documentation: "architecture diagrams that go stale the moment you draw them." The pattern behind it is what our analysis of drift describes as the norm rather than the exception: "architecture evolves through drift," not through deliberate decisions. The gap doesn't open all at once; it opens one small, undocumented change at a time.
None of this makes traditional system diagrams useless. A whiteboard sketch during a design discussion is still one of the quickest ways to align a room on a question. The problem shows up later, when that sketch gets treated as a permanent source of truth instead of a snapshot.
This is the gap we built Catio, the Architecture IDE, to close. Instead of a diagram someone draws once and hopes stays current, our Understand stage maintains a continuously updated model of your architecture, grounded in what's running, not just what's documented. How close that model stays to the current state depends on which sources are connected, how much of the cloud and runtime environment is in scope, how thoroughly repositories are parsed, and how fresh those integrations are kept. Its Compound stage runs drift detection on top of that model, flagging where implementation diverges from the architecture a team actually decided on. Our broader approach to drift asks a more specific question than "did this value change": which decision did this change cross? That matters because a diagram is only a proxy for the real system, and once the two diverge, the diagram actively misleads whoever trusts it.
Our open-source GraphQA project offers a more direct alternative to hunting through a diagram for an answer: it treats a system as a graph you can query in natural language, rather than a picture you have to visually trace. Instead of scanning a diagram to answer "what breaks if this database goes down," you ask directly and get an answer grounded in the current graph.
None of this replaces the value of drawing a system diagram; it changes what happens after you draw it.
Conclusion: Keeping System Diagrams Accurate as Systems Evolve
A system diagram is a simplified visual model of a system's boundary, components, and interactions, useful for communication and early design, but only ever as accurate as the last time someone updated it. Picking the right type for your audience and purpose is most of the battle. Knowing that the diagram starts drifting from reality the moment the system changes again is the other half, and it's the half most guides skip entirely.
If you're drawing system diagrams to get a team aligned today, that's still the right move. But if you're relying on last quarter's diagram to make a decision about today's system, it's worth checking whether the diagram and the system still agree. See how Catio keeps a live model of your architecture aligned with what's actually running, instead of a snapshot that goes stale the moment you draw it.
Frequently Asked Questions
What is a system diagram?
A visual model showing a system's boundary, its major components, and how those components and external entities exchange information. It's built to support communication and early design decisions, not to serve as a precise engineering spec.
What is SysML and UML?
UML models software structure and behavior. SysML is broader, covering software, hardware, and process through a model-based systems engineering approach. Use SysML when your system spans more than software.
What do system diagrams look like?
Most share the same building blocks: a system boundary, the components inside it, inputs and outputs, external factors, and sometimes feedback loops. The visual style (boxes and arrows, network topology, UML notation) depends on the diagram type and audience.
How do you create a simple system diagram?
Define the question the diagram needs to answer, draw a boundary around your system, identify the components that matter for that question, map what crosses the boundary, and validate the result with someone outside the drawing process.
Share this Post